|
#1
 June 5th, 2016, 11:38 AM
| |||
| |||
|
I want to know the Financial Analysis of Hindustan Petroleum Corporation Ltd HPCL so can you please tell me?
 |
|
#2
June 5th, 2016, 12:53 PM
| |||
| |||
|
As you are looking for the Financial Analysis of Hindustan Petroleum Corporation Ltd HPCL so here I am telling you. HPCL Financial Ratios (May 2016) Last Price 909.05 Today's Change 61.35 Open 861.00 Prev Close 847.70 Day's Range (917.00) (861.00) 52 Week Range (991.00) (615.00) Key Financial Ratios of Hindustan Petroleum Corporation- Mar '15 Mar '14 Mar '13 Mar '12 Mar '11 Investment Valuation Ratios Face Value 10.00 10.00 10.00 10.00 10.00 Dividend Per Share 24.50 15.50 8.50 8.50 14.00 Operating Profit Per Share (Rs) 167.34 154.68 125.85 122.00 98.13 Net Operating Profit Per Share (Rs) 6,101.88 6,593.42 6,104.98 5,266.43 3,933.94 Free Reserves Per Share (Rs) -- -- -- -- 352.61 Bonus in Equity Capital 78 78 78 78 78 Profitability Ratios Operating Profit Margin(%) 2.74 2.34 2.06 2.31 2.49 Profit Before Interest And Tax Margin(%) 1.77 1.35 1.09 1.34 1.42 Gross Profit Margin(%) 1.78 1.35 1.1 1.35 1.43 Cash Profit Margin(%) 2.26 1.78 1.33 1.46 2.06 Adjusted Cash Margin(%) 2.26 1.78 1.33 1.46 2.06 Net Profit Margin(%) 1.32 0.77 0.43 0.51 1.15 Adjusted Net Profit Margin(%) 1.31 0.77 0.43 0.5 1.14 Return On Capital Employed(%) 14.68 8.54 7.31 8.48 7.93 Return On Net Worth(%) 17.05 11.54 6.59 6.94 12.26 Adjusted Return on Net Worth(%) 17.03 11.93 5.76 6.94 10.9 Return on Assets Excluding Revaluations 473.15 443.32 405.35 387.52 370.49 Return on Assets Including Revaluations 473.15 443.32 405.35 387.52 370.49 Return on Long Term Funds(%) 15.72 13.11 14.9 17.73 11.29 Liquidity And Solvency Ratios Current Ratio 0.61 0.73 0.68 0.66 0.77 Quick Ratio 0.31 0.57 0.71 0.52 0.44 Debt Equity Ratio 1.06 2.13 2.36 2.09 1.99 Long Term Debt Equity Ratio 0.93 1.04 0.65 0.48 1.1 Debt Coverage Ratios Interest Cover 6.87 3 1.67 1.55 3.37 Total Debt to Owners Fund 1.06 2.13 2.36 2.09 1.99 Financial Charges Coverage Ratio 9.67 4.65 2.66 2.32 4.95 Financial Charges Coverage Ratio Post Tax 7.67 3.95 2.43 2.18 4.32 Management Efficiency Ratios Inventory Turnover Ratio 16.75 12.38 12.58 9.17 8.68 Debtors Turnover Ratio 45.57 42.93 48.64 57.35 52.33 Investments Turnover Ratio 16.75 12.38 12.58 9.17 8.68 Fixed Assets Turnover Ratio 4.33 5.29 5.63 5.37 4.53 Total Assets Turnover Ratio 6.29 4.77 4.49 4.4 3.57 Asset Turnover Ratio 5.16 4.79 4.76 4.56 3.78 Average Raw Material Holding -- -- -- -- 28.29 Average Finished Goods Held -- -- -- -- 32.17 Number of Days In Working Capital - 12.41 14.71 19.49 15.29 18.83 Profit & Loss Account Ratios Material Cost Composition 89.97 92.92 92.72 93.42 94.59 Imported Composition of Raw Materials Consumed 79.76 90.16 86.04 86.16 74.98 Selling Distribution Cost Composition -- -- -- -- 2.23 Expenses as Composition of Total Sales 2.57 1.89 3.1 4.36 4.14 Cash Flow Indicator Ratios Dividend Payout Ratio Net Profit 30.35 30.27 31.81 31.58 30.8 Dividend Payout Ratio Cash Profit 17.6 13.33 9.96 10.96 16.09 Earning Retention Ratio 69.6 70.72 63.63 68.44 65.34 Cash Earning Retention Ratio 82.38 86.86 89.63 89.04 82.92 AdjustedCash Flow Times 3.62 7.99 11.7 10.47 9.02 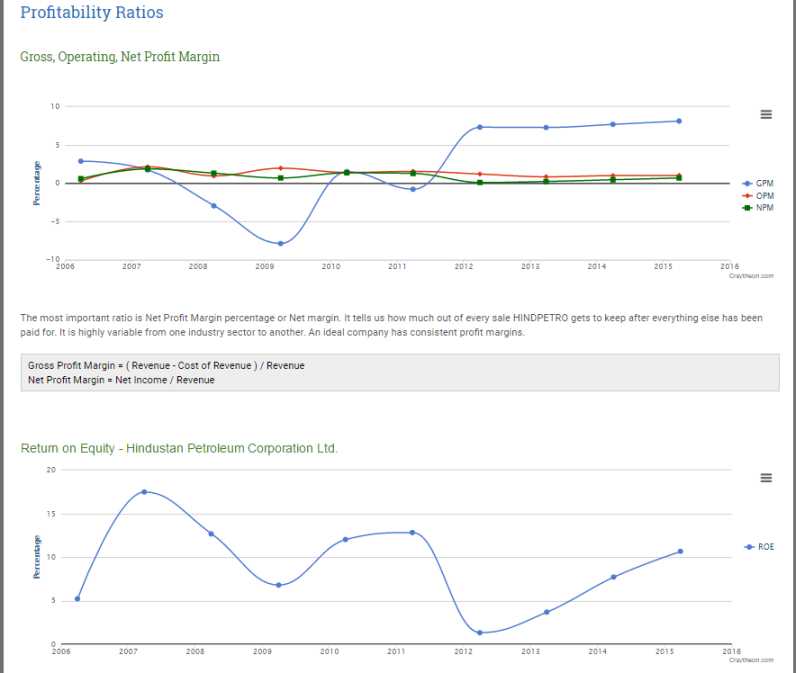   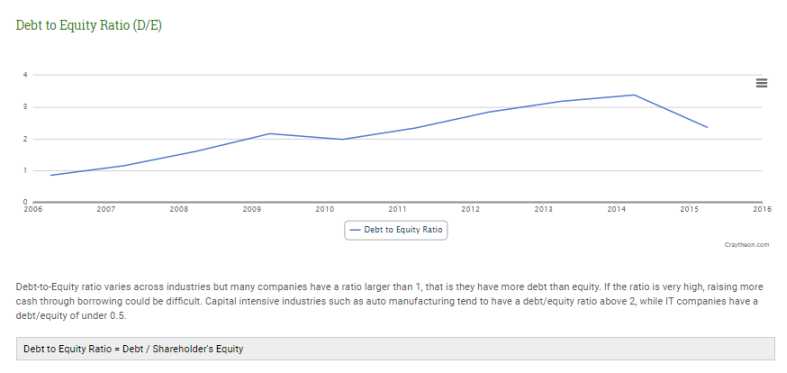
__________________ Answered By StudyChaCha Member |
 |
| |


