|
#1
 July 14th, 2012, 09:54 AM
| |||
| |||
|
What is the Mollier HX Diagram? From where can I get HX Diagram? Das Mollier-h-x-Diagramm (früher i-x-Diagramm) ermöglicht es, Zustandsänderungen feuchter Luft durch Erwärmung, Befeuchtung, Entfeuchtung, Kühlung und Mischung verschiedener Luftmengen zu ermitteln. 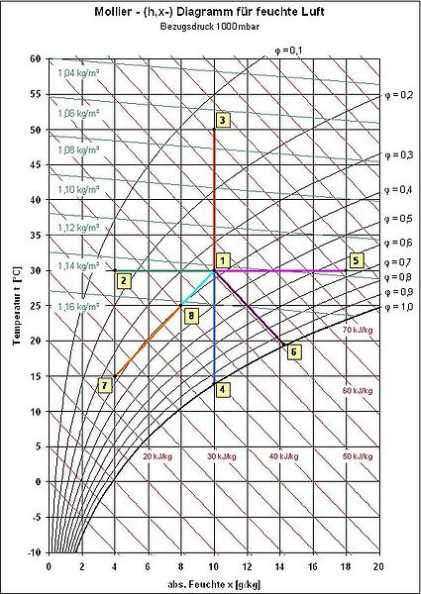 Beispiele zur Anwendung Vorgänge im Diagramm darstellen Luftbefeuchtung Internationale Anwendung 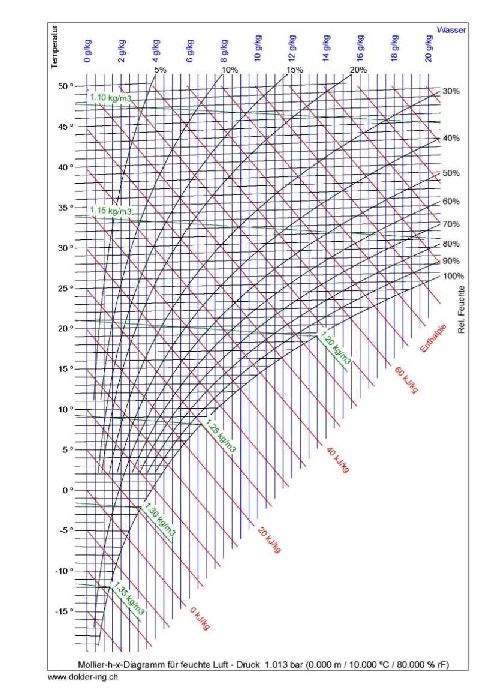   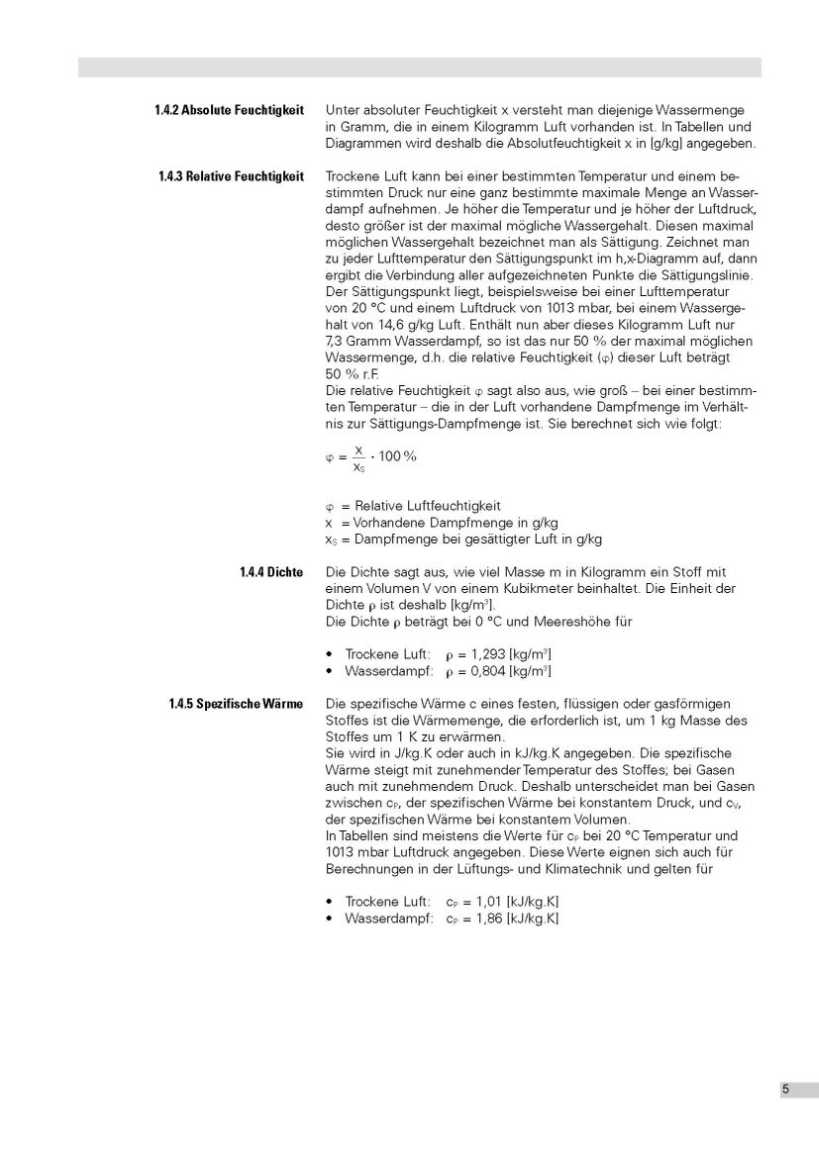  Das h,x-Diagramm Aufbau und Anwendung - Siemens Schweiz AG Last edited by Aakashd; May 30th, 2019 at 08:26 PM.  |
| Other Discussions related to this topic | ||||
| Thread | ||||
| MBAR.dk | ||||
|
#2
September 16th, 2012, 06:55 PM
| |||
| |||
|
Will any one like to give me the link of the page from where I can get the HX Diagram 1013 MBAR, or if you can provide me then please provide me as soon as possible?
|
|
#3
March 13th, 2020, 05:11 PM
| |||
| |||
|
I am doing final year engineering degree and searching for some details about Mollier diagram. Will you provide image how the HX Diagramm 1013 MBAR also provide diagram details in PDF?
|
|
#4
March 13th, 2020, 05:17 PM
| |||
| |||
|
The Mollier diagram is a graphic representation of the relationship between air temperature, moisture content and enthalpy - and is a basic design tool for building engineers and designers HX Diagramm 1013 MBAR looks like: 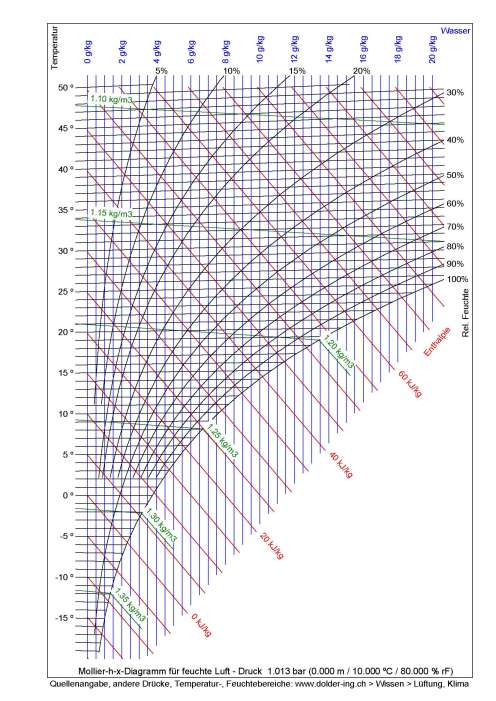 Components and parameters: An h-x diagram specifies all parameters required to describe air conditions: Temperature = t in °C Absolute humidity = x in g/kg Relative humidity = RH in % Specific enthalpy = h in kJ(1+x)kg Density = p in (kg/m3) HX Diagramm Details  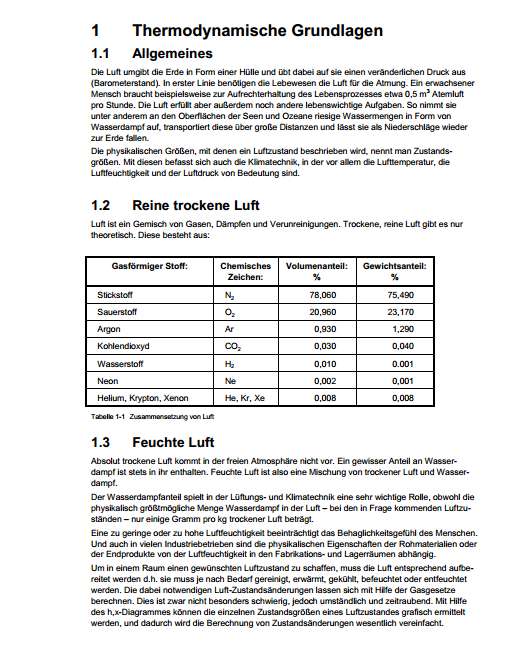  
__________________ Answered By StudyChaCha Member |
 |
| |


